Analytics Behind Retention Patterns in Athletic Event Prediction Memberships
Eden Lange · Jun 11, 2026
Analytics Behind Retention Patterns in Athletic Event Prediction Memberships
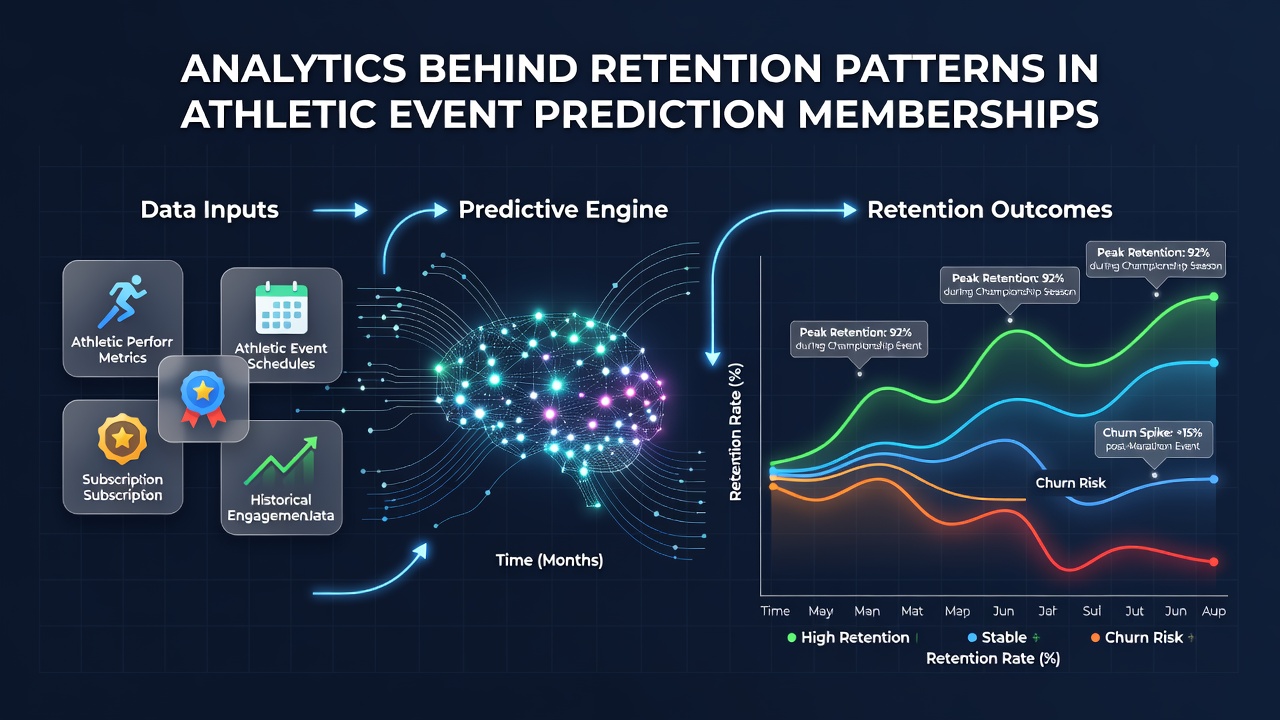
Retention patterns in athletic event prediction memberships emerge from layered data streams that track subscriber behavior across football leagues, racing circuits, and tennis tours, where platforms collect metrics on login frequency, prediction accuracy rates, and post-event interaction spikes. Analysts examine these streams to identify clusters of users who maintain subscriptions through seasonal peaks and troughs, noting how event calendars influence churn rates during high-profile fixtures such as major tournaments scheduled for June 2026. Data aggregation tools process millions of user sessions, revealing correlations between early prediction successes and sustained membership duration across multiple sports categories.
Core Metrics Driving Subscriber Longevity
Subscription platforms apply cohort analysis to segment users by acquisition period, then monitor how those groups respond to event outcomes over subsequent months, with retention curves flattening when prediction models align closely with actual results in competitive draws and finishes. Engagement logs show that members who access detailed statistical breakdowns after each event demonstrate higher renewal probabilities compared to those who limit interactions to basic alerts, according to aggregated platform reports. Variables such as notification timing and personalized result recaps factor into these patterns, while external factors including schedule disruptions from weather or venue changes introduce measurable variance in activity levels.
Event Timing and Churn Correlations
Seasonal calendars shape retention trajectories, as analysts observe elevated cancellation clusters immediately following marquee competitions where prediction volumes surge yet accuracy fluctuates, prompting users to reassess value propositions. Researchers at institutions across Europe and North America have documented similar sequences in studies of digital sports services, where post-event data feeds highlight dips in active sessions lasting several weeks before stabilization occurs. Platforms counter these shifts through targeted content updates that reference historical performance streaks, and figures from industry tracking services indicate that memberships tied to year-round coverage maintain steadier retention than those focused solely on peak tournament windows.
Behavioral Signals in Prediction Accuracy Feedback Loops
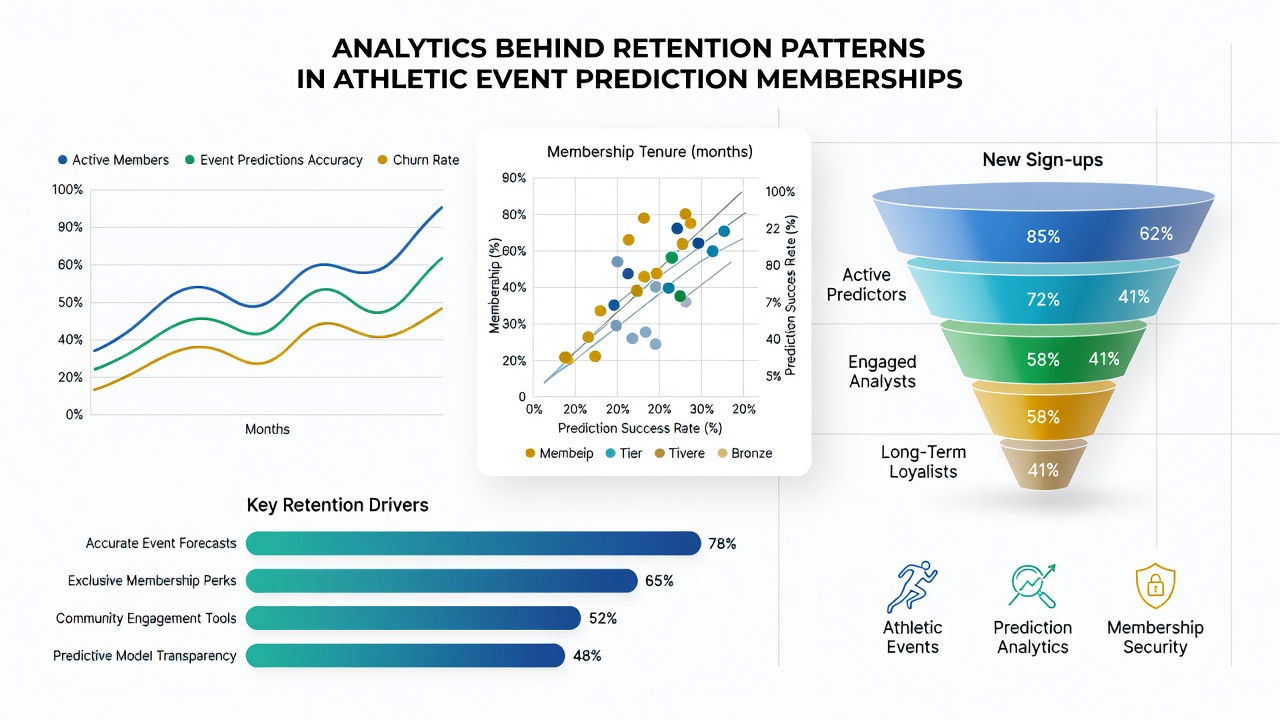
Feedback mechanisms embedded in membership portals capture user ratings on individual predictions, feeding machine learning models that refine future outputs and indirectly support retention by aligning content with subscriber expectations. Observers note that members who engage with accuracy dashboards over consecutive events exhibit prolonged subscription spans, whereas sporadic users drift toward expiration when perceived edges diminish. Data pipelines integrate these signals with broader market indicators, such as odds movements tracked by regulatory bodies including the Australian Communications and Media Authority, to contextualize how external betting environments influence platform loyalty. One study released by a Canadian research consortium in 2025 illustrated connections between transparent performance reporting and reduced churn across multi-sport prediction services.
Segmented User Journeys Across Sports Disciplines
Retention analytics differentiate between user segments attracted to distinct athletic domains, with football-focused members showing steadier patterns during league phases while racing enthusiasts demonstrate sensitivity to fixture density and tennis subscribers respond more to individual match granularity. Cross-referencing these segments reveals hybrid users who span categories and sustain longer tenures when platforms deliver unified dashboards covering varied event types. Analysts employ survival models to estimate lifetime value, factoring in variables such as geographic location and device preferences that correlate with renewal consistency. Reports compiled by the European Gaming and Betting Association highlight how integrated analytics frameworks help platforms anticipate drop-off points and deploy preemptive engagement tactics without altering core prediction methodologies.
Integration of External Data Sources
Platforms supplement internal logs with third-party datasets on attendance figures, injury reports, and weather conditions to enrich retention forecasts, allowing finer calibration of prediction relevance during atypical event conditions. This layered approach surfaces patterns where members retain access longer when supplemental context accompanies core forecasts, particularly around international competitions slated for mid-2026. Academic papers from universities in Asia and Oceania have examined parallel dynamics in subscription services, confirming that multi-source data fusion strengthens predictive accuracy around churn events. Those models incorporate time-series elements that project membership trajectories based on historical sequences observed in comparable athletic calendars.
Conclusion
Analytics frameworks continue to evolve as platforms refine their capacity to interpret retention signals from athletic event prediction memberships, drawing on expanding datasets that span user interactions and event variables. These systems deliver actionable insights for service adjustments while preserving the factual foundation of performance tracking across football, racing, and tennis domains. Ongoing developments in data integration point toward more precise mapping of loyalty drivers as membership ecosystems mature through 2026 and beyond.