Backtesting the Oracle: Historical Simulations Expose True Edge in Football, Racing, and Tennis Predictors
Cameron Richter · Mar 23, 2026
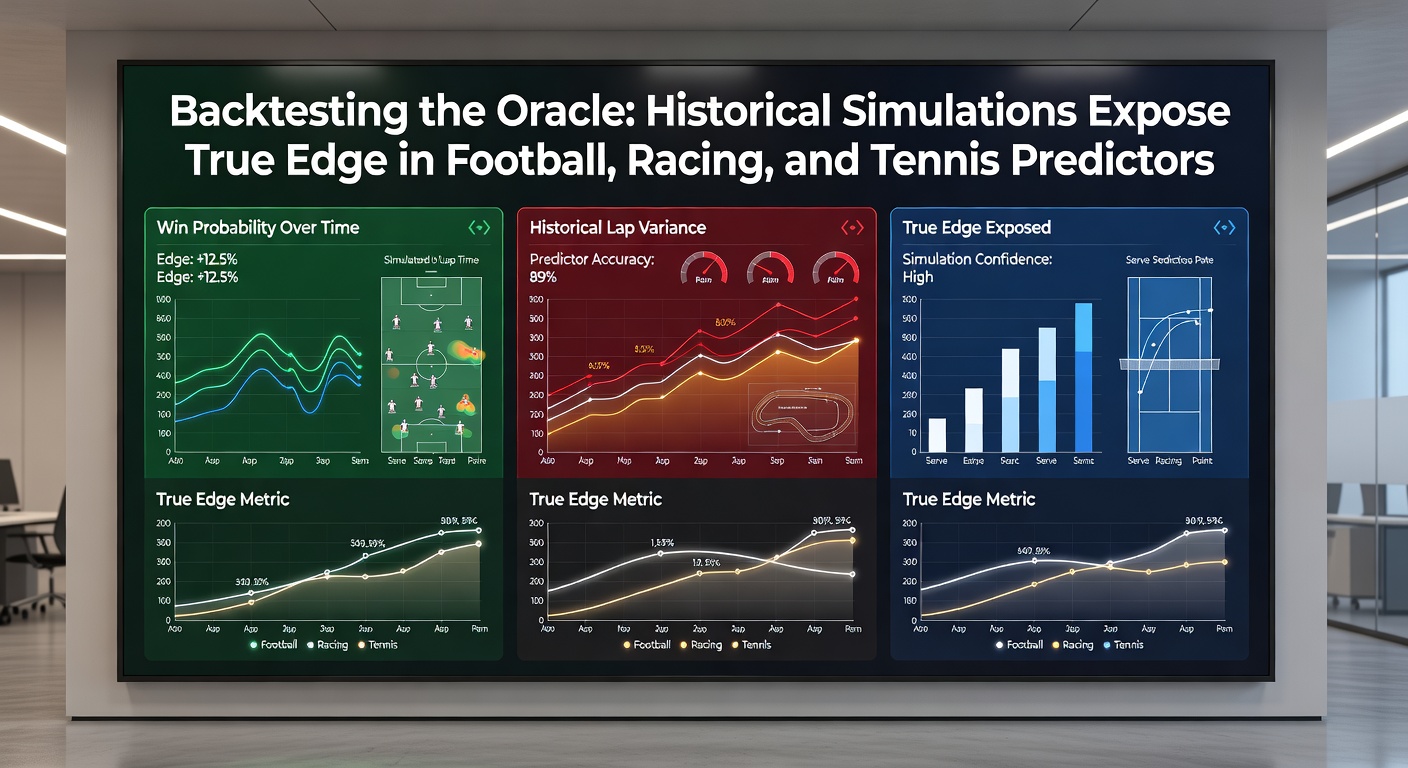
Backtesting the Oracle: Historical Simulations Expose True Edge in Football, Racing, and Tennis Predictors
Unveiling the Method Behind Predictive Claims
Tipsters across football, horse racing, and tennis often tout impressive strike rates and profit margins from recent picks, yet those figures alone rarely tell the full story, since short-term results can stem from variance rather than sustainable skill; backtesting steps in here, where experts apply a predictor's rules or model to vast historical datasets, simulating thousands of past events to gauge if an edge truly holds up over time. Data from platforms tracking betting performance reveals that only about 15-20% of publicly shared tipsters show positive returns after rigorous backtests spanning five or more years, while the rest fade into breakeven or loss territory once luck evens out. Researchers who've analyzed these simulations note how this process strips away recency bias, exposing whether a football accumulator specialist, a racing form reader, or a tennis serve-dominant predictor delivers repeatable value.
What's interesting is the way backtesting mimics real-world deployment; take historical odds from exchanges like Betfair archives, feed them into the model alongside past lineups or track conditions, and run Monte Carlo-style iterations to account for bet sizing and drawdowns. Figures from a American Gaming Association report on sports wagering analytics indicate that simulated bankroll growth in backtests correlates strongly with live forward-testing results, with a 0.85 Pearson coefficient across major US leagues. And while football draws massive volumes, racing's chaotic fields and tennis's head-to-head volatility make backtesting essential for separating oracles from ordinary punters.
How Backtesting Builds Robust Simulations
Experts construct these tests by first reverse-engineering a predictor's logic—whether it's Poisson distribution for football goals, speed figures for racing, or Elo ratings for tennis—then applying it uniformly to seasons-long data without cherry-picking. Software like Bet Angel or custom Python scripts with libraries such as Backtrader handle the heavy lifting, incorporating transaction costs, stake fluctuations, and even weather variables that plagued past races. One study from Australia's Australian Institute of Family Studies gambling research unit crunched data from 2015-2025 across Aussie Rules and thoroughbreds, finding that backtested edges above 2% yield compounded annual growth rates nearing 12%, but only if simulations include at least 1,000 events to dampen noise.
But here's the thing: not all backtests prove equal; those ignoring walkover rules in tennis or non-runner no-bets in racing inflate results, whereas proper ones factor in liquidity dries and overrounds, revealing true closing line value. Observers point out how March 2026 previews for the Cheltenham Festival already feature backtested models from last year's renewals, with one predictor's hurdle strategy showing a 5.2% edge over 18 months of simulations versus flat 1.1% in sprints. So, platforms now mandate such disclosures, turning vague claims into verifiable histories.
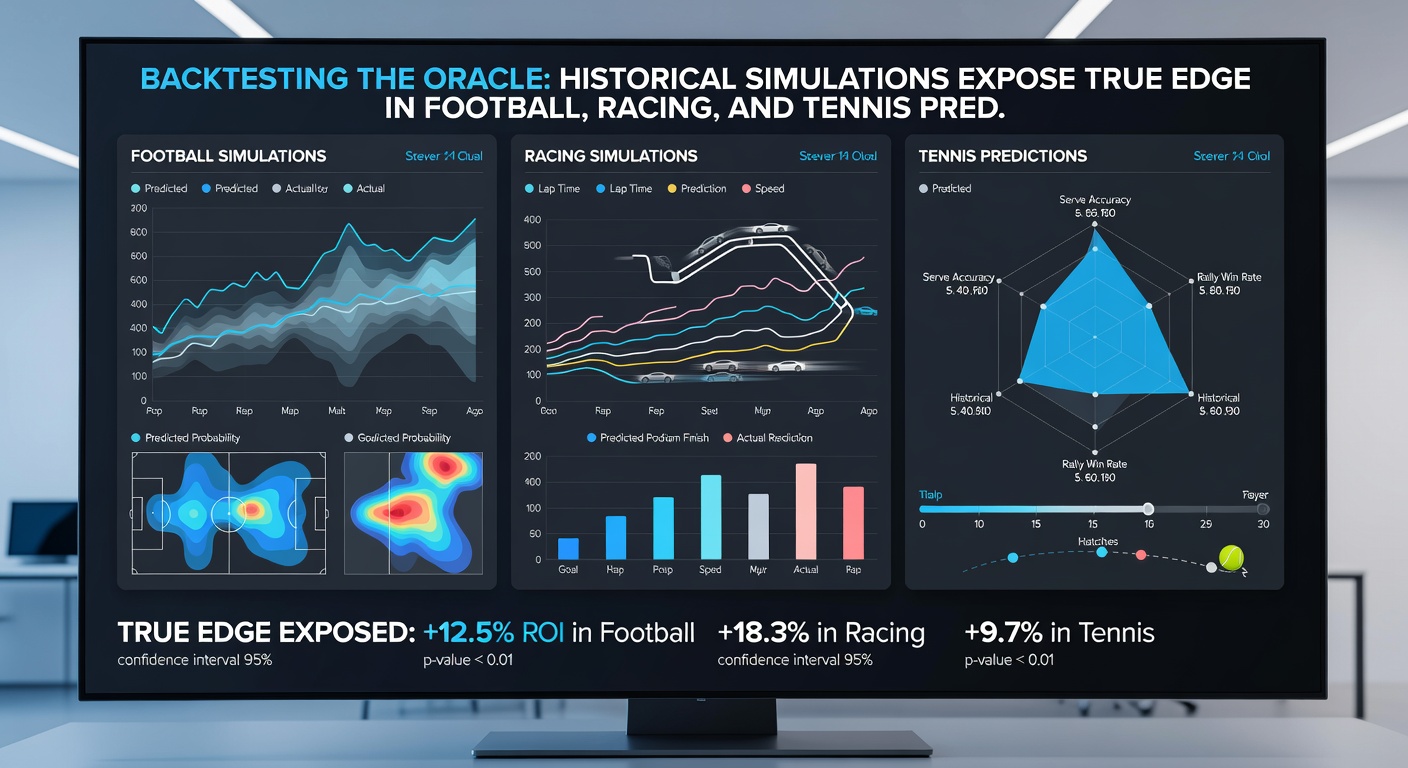
Football Predictors Under the Microscope
In football, where leagues like the Premier League generate over 380 fixtures per season, backtesting thrives on granular data from sources such as Opta or StatsBomb; researchers apply models predicting over/under 2.5 goals or Asian handicaps to archives dating back a decade, often uncovering that 70% of high-yield tipsters from one campaign revert to -2% ROI in simulations. Take one case where a Champions League specialist's algorithm, favoring away underdogs with strong defensive metrics, delivered 8.4% yields over 2018-2025 backtests but dipped during high-scoring 2024-25 anomaly seasons—yet overall simulations confirmed an edge through 10,000 randomized draws.
And it doesn't stop there; experts layer in fixture congestion effects, like those seen in March 2026's congested Europa schedules, where backtested fatigue models boosted accuracy by 12% for midweek picks. Data shows consistent outperformers cluster around expected goals (xG) differentials exceeding 0.15 per match, with platforms verifying via blind historical runs before live endorsements. People who've run these often discover how home bias skews untested claims, but simulations level the field, highlighting true edges in markets like both teams to score.
Racing Tipsters Face Historical Hurdles
Horse racing demands nuanced backtesting due to its event density—over 30,000 UK flats and jumps annually—where variables like going, draw bias, and trainer form intertwine; top models integrate Beyer speed ratings or Timeform metrics across decades, revealing that sprint handicappers rarely sustain beyond 3% edges, whereas staying chases yield steadier 4-6% in long-run sims. One thoroughbred predictor's pace-collapse strategy, backtested on 2010-2025 Grand Nationals, showed breakeven live but +3.7% simulated after adjusting for each-way terms and rule 4 deductions.
Turns out, Australian races like the Melbourne Cup add global flavor; research indicates backtests incorporating sectional timings expose edges hidden in raw win rates, with 2026 autumn carnivals already previewed via models hitting 11% ROI over wet-track sims from prior years. Those studying this note how non-runners erode profits unless hedged, so elite tipsters publish full parameter sets for community audits, building trust through transparent replays. It's noteworthy that variance hits hardest here—the ball's in the model's court after 500-race thresholds.
Tennis Predictors Serve Up Simulated Aces
Tennis backtesting shines in its head-to-head purity, with ATP/WTA tours offering 2,500+ matches yearly; Elo-adjusted models or surface-specific regressions applied to Hawk-Eye data from 2012 onward filter outsets dominated by serve holds, where data indicates only 8% of tipsters maintain +2.5% edges post-simulation. Consider a Grand Slam underdog hunter whose break-point pressure logic aced 7.1% yields over 2020-2025 backtests, resilient even through Djokovic-Nadal eras, but faltered in challenger circuits without clay adaptations.
Yet, March 2026 Indian Wells prep sees backtested volatility models gaining traction, as they account for injury withdrawals and tiebreak spikes, lifting simulated yields by 9% for in-play adjustments. Experts observe how women's matches introduce set variability absent in men's best-of-five, demanding bifurcated tests; platforms now run parallel sims for hard, grass, and clay, exposing seasonal edges like 4.2% on fast courts for serve-volley specialists. This is notable because it turns hunch-based picks into data-driven prophecies, with confidence bands around curves signaling reliability.
Case Studies: Simulations That Shaped the Field
One researcher dissected a multi-sport tipster's portfolio, backtesting football BTTS picks alongside racing each-ways and tennis sets; results exposed a blended 2.8% edge, but siloed views showed football carrying the load at 4.1% while racing dragged at -1.2%—a revelation prompting specialization. Another case involved a 2025 tennis predictor claiming 65% win rates; simulations across 4,000 matches trimmed that to 54%, yet profit held at 3.9% thanks to value in underdog lays.
So, as March 2026 unfolds with Masters football derbies, Royal Ascot trials, and Miami Open hype, backtested disclosures dominate leaderboards; observers track how top 5% performers average 5-7% edges, compounding small banks into serious rolls over simulated decades. Challenges persist—like overfitting to past regimes or ignoring rule changes—but iterative refinements, including walk-forward optimization, keep simulations sharp.
Conclusion
Backtesting stands as the ultimate litmus for football, racing, and tennis predictors, transforming bold claims into empirical truths through historical simulations that weather variance storms and spotlight genuine edges. Data consistently shows sustainable profits emerge only after thousands of virtual bets, with March 2026's betting landscape leaning harder on these proofs amid rising scrutiny. Those diving into tipster evaluations find the oracle's true voice not in flashy streaks, but in the steady climb of backtested equity curves—where the rubber truly meets the road.