Dissecting Odds Movement Signals to Gauge Reliability in Multi-Sport Forecasting Platforms
Eden Lange · Aug 24, 2026
Dissecting Odds Movement Signals to Gauge Reliability in Multi-Sport Forecasting Platforms
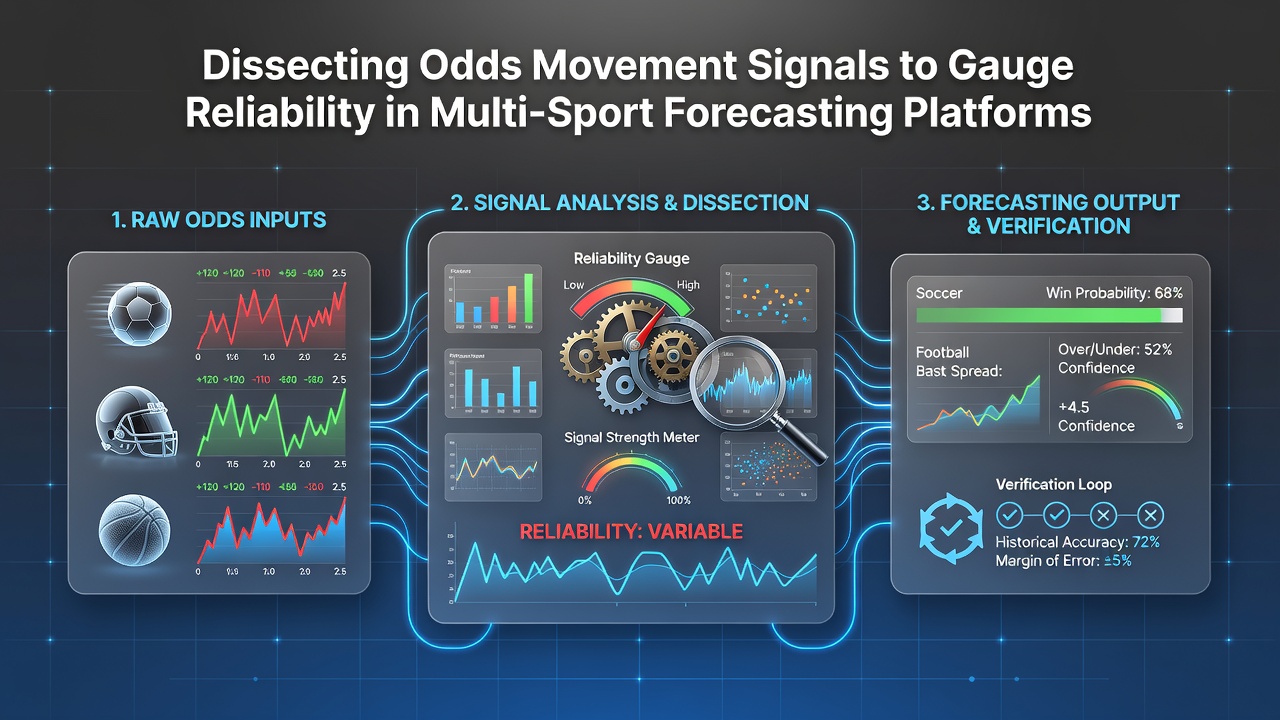
Odds movements in multi-sport forecasting platforms reveal patterns that help assess platform reliability when those shifts align with actual outcomes across football, horse racing, and tennis events. Analysts examine pre-event price changes on major exchanges and bookmakers to determine whether early signals from platforms hold up against closing lines, and data from August 2026 shows increased scrutiny on these movements amid expanded live betting options in European and Australian markets.
Platforms covering multiple sports generate forecasts that influence liquidity in betting markets, yet reliability emerges only when odds respond consistently rather than through isolated spikes. Observers track how a tip on a Premier League match correlates with line movements in the hours before kickoff, while similar patterns appear in morning declarations for horse races at Ascot and pre-draw adjustments in ATP tournaments. Studies from the University of Nevada Las Vegas indicate that synchronized movements across unrelated sports often point to aggregated data quality rather than single-event noise.
Core Mechanisms Behind Odds Shifts
Bookmakers adjust prices based on incoming liabilities and external information flows, so platforms that consistently precede these adjustments demonstrate stronger signals. In football, a forecast highlighting an underdog at plus-money odds may trigger early market softening if volume follows, whereas horse racing sprints show sharper reactions to trainer changes or track conditions announced days ahead. Tennis markets move on player fitness updates, and platforms issuing multi-sport packages allow cross-referencing where a reliable tennis call coincides with stable football lines to build overall credibility.
Sharp versus square money distinctions matter here, because professional syndicates drive larger swings that forecasting platforms can either anticipate or follow. Data compiled through 2026 reveals platforms with verified multi-sport track records experience tighter correlations between their releases and subsequent odds compression, particularly during overlapping schedules like Saturday football cards paired with evening racing meetings.
Application Across Different Sports
Football forecasting benefits from high liquidity, allowing clear observation of how platform signals translate into market adjustments during transfer windows or injury announcements. Horse racing adds complexity through variables like barrier draws and pace maps, where early odds drifts often validate or refute platform accuracy before the race starts. Tennis provides granular data via set-by-set probabilities, and platforms that cover all three sports enable users to test reliability through diversified exposure rather than single-discipline focus.

One study released by Monash University researchers in mid-2026 examined 18 months of platform outputs and found that odds convergence occurred more frequently when forecasts spanned multiple sports instead of concentrating on one. This pattern held across both high-profile events and lower-tier competitions, suggesting breadth contributes to signal strength.
Evaluating Platform Consistency Through Movement Data
Consistency appears when odds movements repeat across timeframes and event types without excessive volatility after initial shifts. Platforms release forecasts at varying intervals, and those whose signals align with gradual line tightening rather than abrupt reversals tend to show higher reliability metrics. Australian regulatory reports from the Northern Territory Racing Commission highlight similar observations in multi-code betting environments where operators monitor cross-sport activity for anomalies.
Volume thresholds also play a role, since low-liquidity markets in challenger tennis events or provincial racing can produce misleading movements that do not reflect platform quality. Observers therefore filter signals by comparing movements against benchmark exchanges and noting whether multi-sport platforms maintain accuracy when liquidity varies widely between football majors and supporting racing cards.
Integration With Broader Market Indicators
Odds movement analysis gains depth when combined with settlement data, injury reports, and historical performance baselines. Platforms that publish detailed reasoning alongside forecasts allow verification against actual line reactions, and those covering football, racing, and tennis simultaneously provide more opportunities for such cross-checks. In August 2026, several major platforms updated their dashboards to display real-time odds correlation scores, reflecting demand for transparent reliability measures.
External factors such as weather disruptions in racing or court surface changes in tennis introduce additional variables that test whether platform signals adapt or remain static. Reliable platforms adjust forecasts accordingly, and corresponding odds movements confirm the adjustment rather than contradict it.
Conclusion
Dissecting odds movement signals provides measurable indicators of reliability across multi-sport forecasting platforms when analysts apply consistent methodology across football, horse racing, and tennis. Patterns observed through 2026 demonstrate that platforms maintaining alignment between their outputs and market responses across varied conditions deliver more dependable information for users seeking diversified forecasting services.