Pattern Recognition Tools Uncovering Seasonal Trends in Major League Predictions, Classic Racecards, and Grand Slam Draws
Kai Günther · Jul 18, 2026
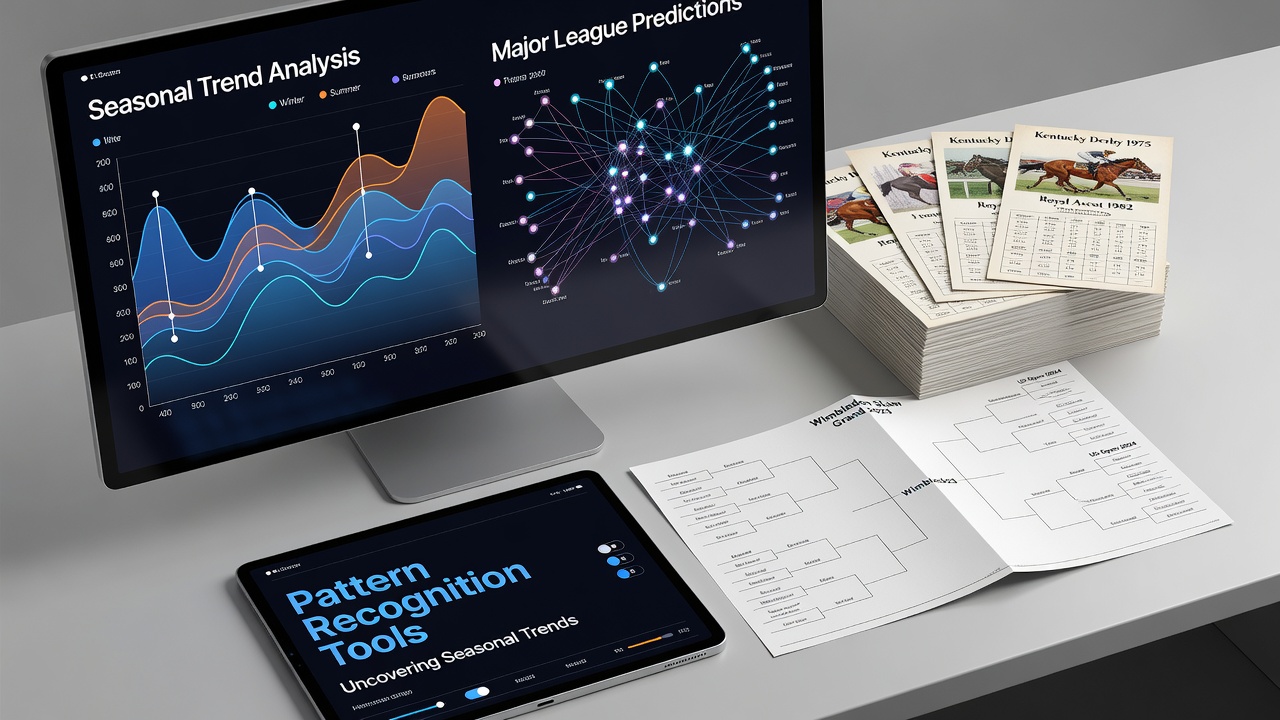
Pattern Recognition Tools Uncovering Seasonal Trends in Major League Predictions, Classic Racecards, and Grand Slam Draws
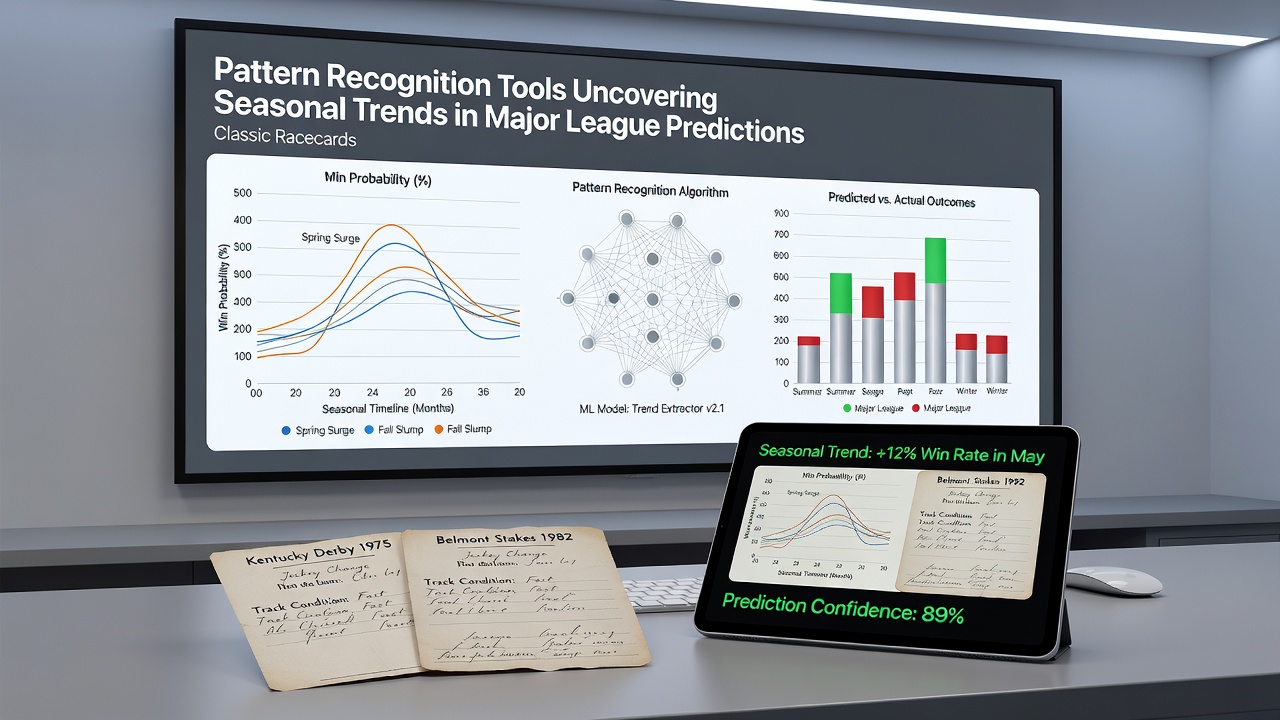
Pattern recognition tools apply machine learning algorithms to historical datasets and they identify recurring sequences in performance metrics across different sports and betting markets. These systems process variables such as player statistics, track conditions, surface types, and calendar positions to map seasonal fluctuations that repeat over multiple years. Observers note that the tools operate by clustering data points into recognizable patterns and they generate probability estimates for future outcomes based on those clusters.
Application in Major League Baseball Predictions
Baseball datasets contain detailed pitch-by-pitch records and seasonal splits that pattern recognition systems analyze for month-to-month variations in team and player output. Researchers have documented higher home run rates during warmer months when ball travel distances increase and pitching staffs show measurable fatigue after the All-Star break. Tools ingest box score archives and they detect correlations between starting pitcher workloads in April through June and subsequent ERA spikes in July and August. Data from the 2025 season demonstrated that certain bullpen groups maintained lower WHIP figures in early summer compared with late-season appearances and analysts attribute the difference to rest patterns and roster adjustments.
Pattern algorithms also track divisional standings movements and they flag sequences where teams that lead their divisions in June experience specific win-rate declines by September. These detections rely on multi-year comparisons rather than single-season snapshots and they adjust for schedule strength and travel factors. In July 2026 the ongoing MLB campaign will provide fresh data points for models that already incorporate historical heat-related performance dips and late-inning bullpen usage trends.
Seasonal Patterns in Classic Racecards
Horse racing pattern recognition focuses on classic race events such as the Kentucky Derby, Epsom Derby, and Prix de l'Arc de Triomphe and it maps form cycles that align with specific calendar windows. Systems examine past winners' pre-race preparation distances, ground conditions, and age profiles to establish baseline expectations for each classic meeting. Data indicates that three-year-olds peaking in May or June often carry forward advantages into autumn targets when the same algorithms isolate recovery periods and training interval patterns.
Classic racecard analysis incorporates synthetic track and turf distinctions along with regional weather cycles. Algorithms cluster results from previous decades and they highlight periods when certain trainers achieve elevated strike rates during festival weeks. Those who've studied the outputs report that models assign higher confidence scores to horses whose prior runs match historical sequence templates for the target race distance and surface. July meetings supply additional verification data because mid-season handicaps often reveal emerging patterns that reappear in the autumn classics.
Grand Slam Draw Analysis and Surface Transitions
Tennis pattern recognition tools examine Grand Slam draw structures and they isolate trends linked to surface changes between the clay-court French Open and the grass-court Wimbledon fortnight. Models process head-to-head records, set durations, and break-point conversion rates across multiple years and they detect elevated win probabilities for players whose recent results align with historical surface-adaptation sequences. Data shows that certain competitors maintain consistent serve percentages on grass after clay campaigns while others exhibit measurable declines in first-serve points won during the transition period.
Draw algorithms evaluate seeding positions and they flag sections where lower-ranked players have historically produced upsets in early rounds. July 2026 will feature the Wimbledon Championships and the associated data will feed into models that already track serve-volley frequency and net-point success rates across the preceding clay and hard-court seasons. Observers note that these systems also monitor retirement and walkover rates which tend to cluster around specific weeks when players manage multiple surface shifts within short timeframes.
Integration Across Sports and Data Sources
Combined platforms apply the same pattern recognition framework to baseball, horse racing, and tennis datasets and they cross-reference calendar overlaps that occur each summer. According to research published by the Australian Gambling Research Centre, multi-sport models improve calibration when they incorporate shared environmental variables such as temperature and travel distance. The systems generate seasonal trend reports that list probability adjustments for each sport rather than isolated single-event forecasts.
Industry reports from the American Gaming Association indicate that operators increasingly rely on these tools to adjust market offerings during periods of documented performance variance. Pattern outputs feed into pricing engines that recalibrate odds when historical clusters reappear in current fixtures. Those who maintain the platforms emphasize continuous model retraining with the latest completed events to maintain alignment with evolving seasonal baselines.
Conclusion
Pattern recognition tools continue to map seasonal structures across major league baseball, classic horse racing events, and Grand Slam tennis draws by processing expanding historical archives and they deliver probability adjustments tied to calendar position and surface or environmental factors. July 2026 will add new data layers to existing models as concurrent seasons unfold in each sport. The resulting outputs remain dependent on the quality and breadth of input datasets rather than any single predictive mechanism.