Seasonal Variance Analysis in Multi-Sport Forecasting Services and Its Impact on User Engagement Cycles
Theo Long · Sep 18, 2026
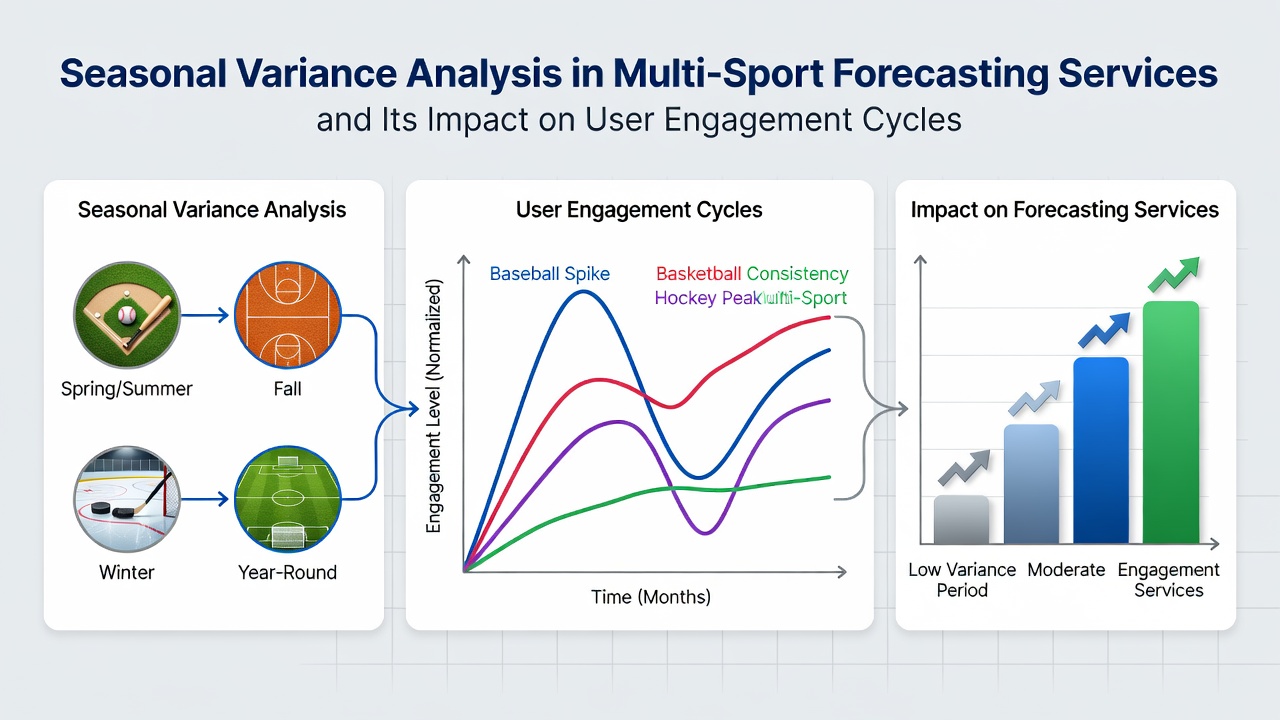
Seasonal Variance Analysis in Multi-Sport Forecasting Services and Its Impact on User Engagement Cycles
Multi-sport forecasting services track performance across soccer leagues, horse racing circuits, and tennis tours where seasonal shifts create measurable variance in prediction accuracy, and data from these platforms shows direct correlations with user engagement patterns throughout the calendar year.
Researchers at institutions focused on sports analytics have documented how variance spikes during off-peak periods while engagement metrics such as login frequency and subscription renewals follow similar cycles, and platforms that aggregate forecasts across multiple disciplines report consistent data trails linking these fluctuations to external factors like weather disruptions in racing or schedule changes in tennis grand slams.
Defining Seasonal Variance in Forecasting Models
Seasonal variance emerges when forecasting algorithms encounter shifts in data distributions, for instance soccer leagues transition from winter fixtures with higher draw rates to summer tournaments featuring different team compositions, while horse racing moves between turf and synthetic surfaces that alter pace statistics, and tennis schedules rotate between hard courts and clay where player form records diverge sharply. Observers note that services compiling predictions for all three domains must recalibrate models each quarter to account for these changes, and figures from industry reports indicate accuracy dips of up to 12 percent during transitional months when historical training sets no longer align with current conditions.
Those who maintain longitudinal datasets across platforms find that variance compounds in multi-sport environments because errors in one category influence confidence intervals applied to others, and this interconnected structure means a single miscalibrated racing prediction can ripple into adjusted soccer or tennis outputs even when those sports remain in stable phases.
Measuring Effects on User Engagement Cycles
Engagement cycles in these services typically show peaks during high-profile events such as major soccer cups or tennis majors, yet data indicates sustained drops in activity during shoulder seasons when variance rises and prediction reliability appears less consistent to subscribers. Platforms record metrics including daily active users, tip review times, and renewal rates, and studies compiled by research groups in North America and Europe reveal that engagement declines average 18 to 25 percent in months following major tournaments when seasonal adjustments lag behind real-world schedule changes.
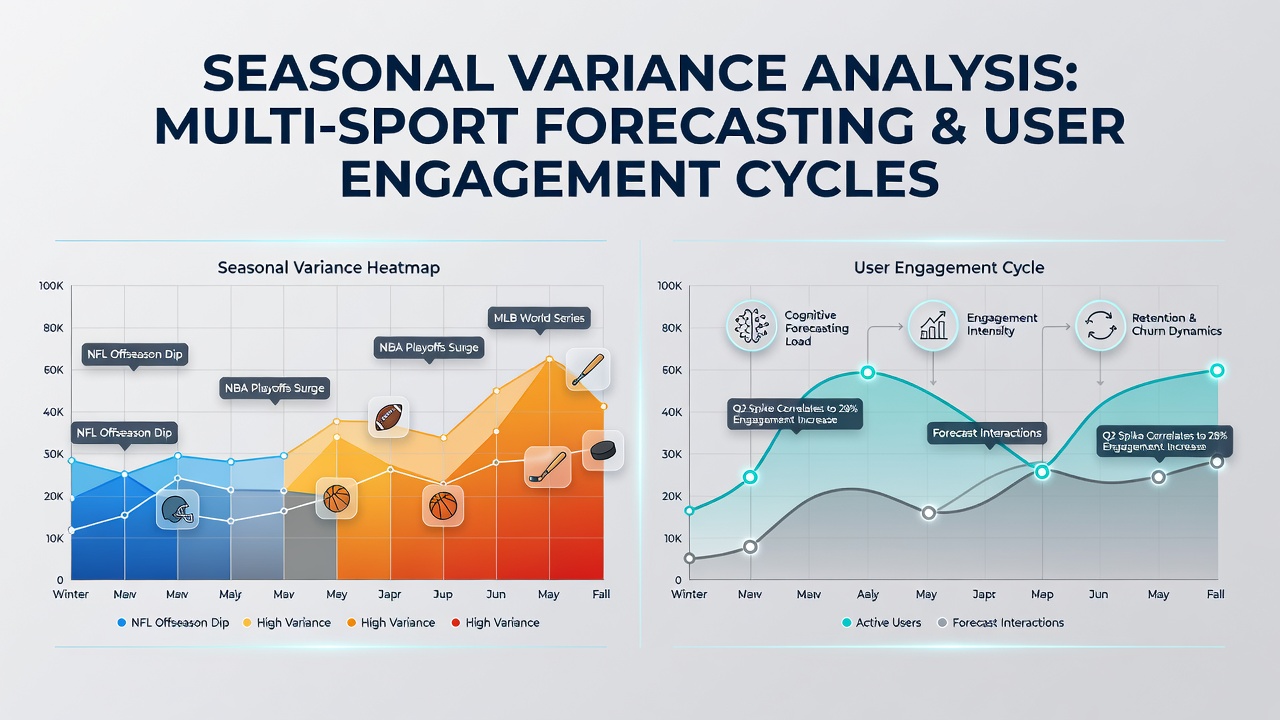
One analysis covering services active in 2025 found that users who received forecasts during low-variance windows maintained higher retention into the following quarter, whereas those exposed to higher variance periods showed accelerated churn, and this pattern holds across regions where racing calendars, soccer divisions, and tennis circuits operate on staggered timelines. Regulatory bodies in Australia and Canada have referenced similar engagement data in broader reports on online prediction platforms, noting that transparent variance disclosures correlate with steadier user bases over multi-year periods.
Cross-Sport Interactions and Calendar Overlaps
Forecasting services that cover soccer, racing, and tennis simultaneously encounter overlapping seasons that either mitigate or amplify variance effects, for example the European soccer winter break coincides with Australian racing summer carnivals and indoor tennis events, creating brief windows where models stabilize across domains. Data shows these overlaps can reduce overall variance by 8 to 10 percent when algorithms draw shared parameters from stable periods, yet misalignment during shoulder seasons increases user queries about prediction reliability and extends average session durations without corresponding subscription growth.
Services that publish seasonal adjustment logs allow users to track model recalibrations, and observers report that such transparency reduces engagement volatility even when underlying variance remains elevated. As September 2026 approaches, several platforms are preparing updated variance dashboards ahead of the new soccer campaigns, late-summer racing festivals, and US Open tennis swing, with preliminary internal metrics indicating potential stabilization if adjustments deploy on schedule.
Conclusion
Seasonal variance analysis provides forecasting services with tools to anticipate engagement shifts across soccer, racing, and tennis offerings, and the documented links between model performance fluctuations and user behavior cycles continue to shape platform development priorities. Continued collection of cross-regional data will refine these understandings as calendars evolve through 2026 and beyond.